
ANOMALIES
The Data Doesn't Lie.
In the Municipal Election in April 2025, many were shocked when 222 of 280 Democrats won the local races by a 79% margin. Entire townships flipped from Red to Blue. How could this be after the landslide Republican victories that occurred just a few months before?
As we studied the data, we discovered multiple anomalies that had little chance of occurring naturally but continued to show up across DuPage County and then as we looked further, showed up in many other counties in the state.
Remember, this data is publicly available right on the county websites.
Perfect Rankings
Statistically the results of the 2025 Municipal Election in Illinois are extraordinary.
Candidates rank identically across every voting category -
How does that happen?
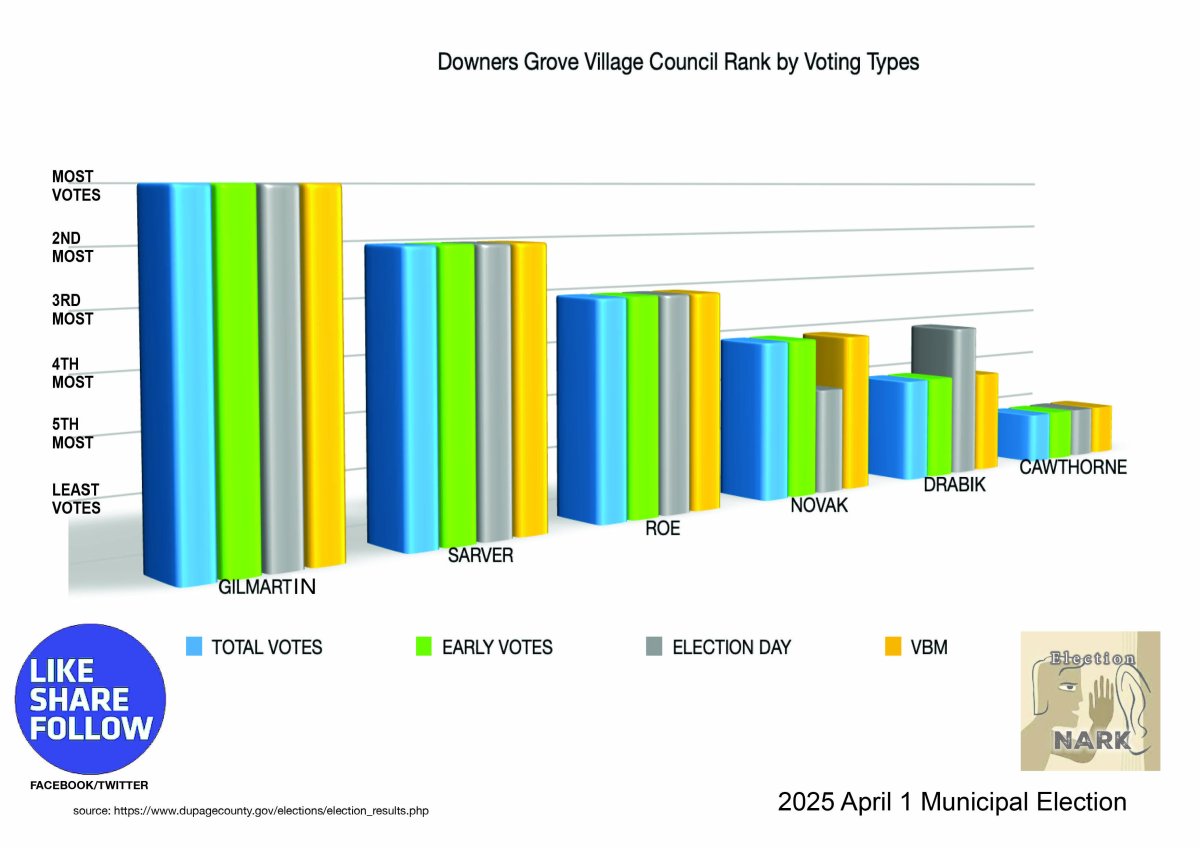
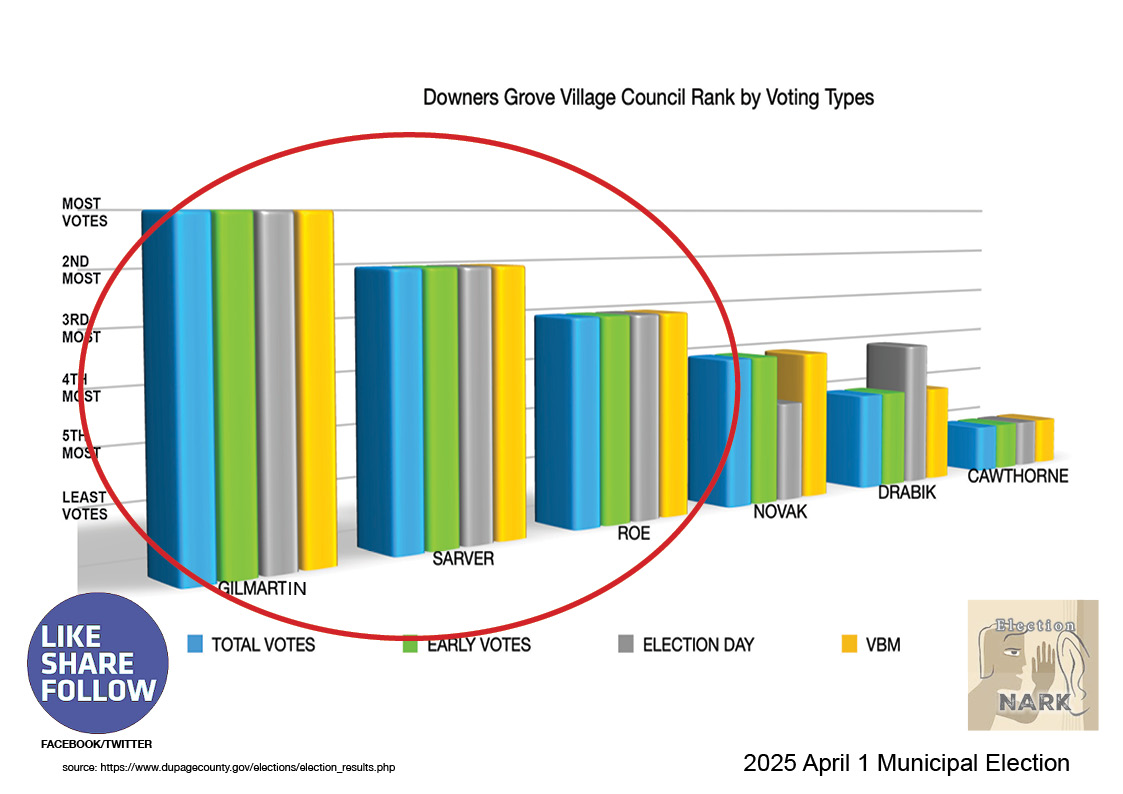
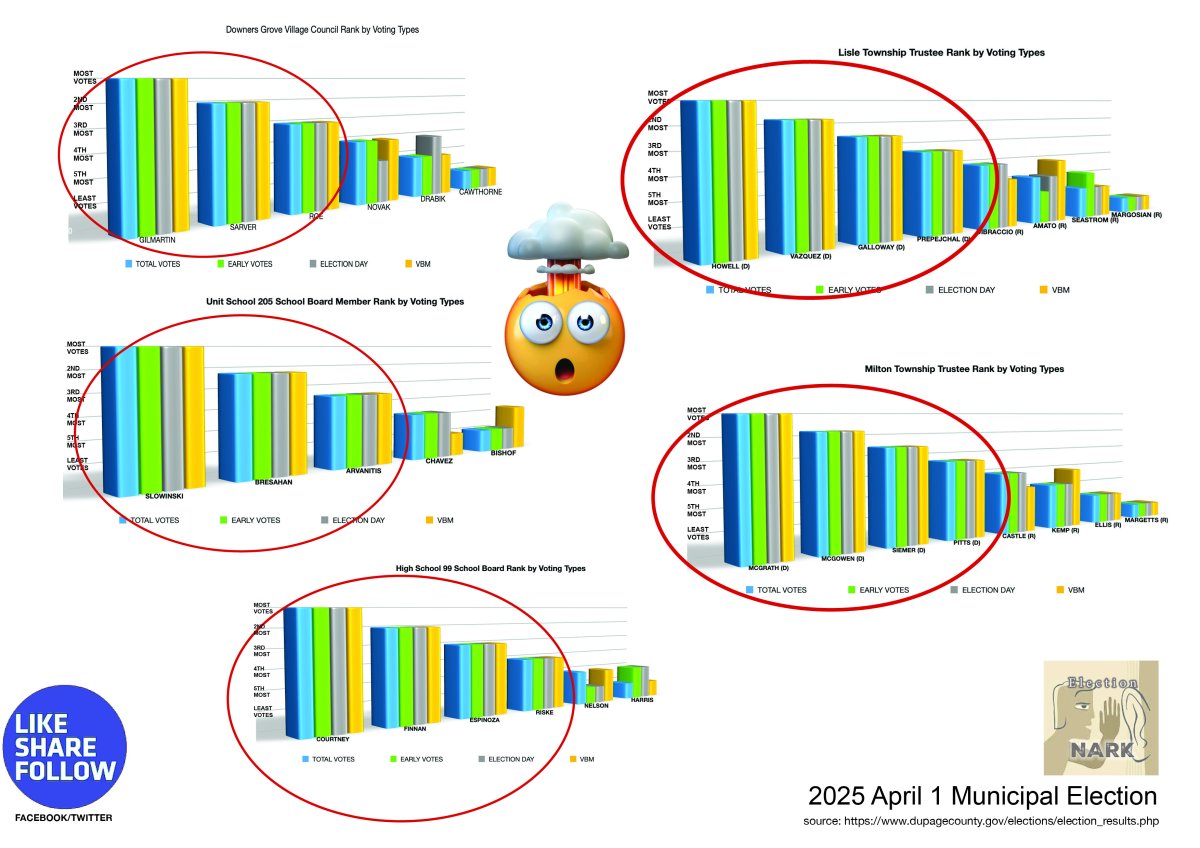
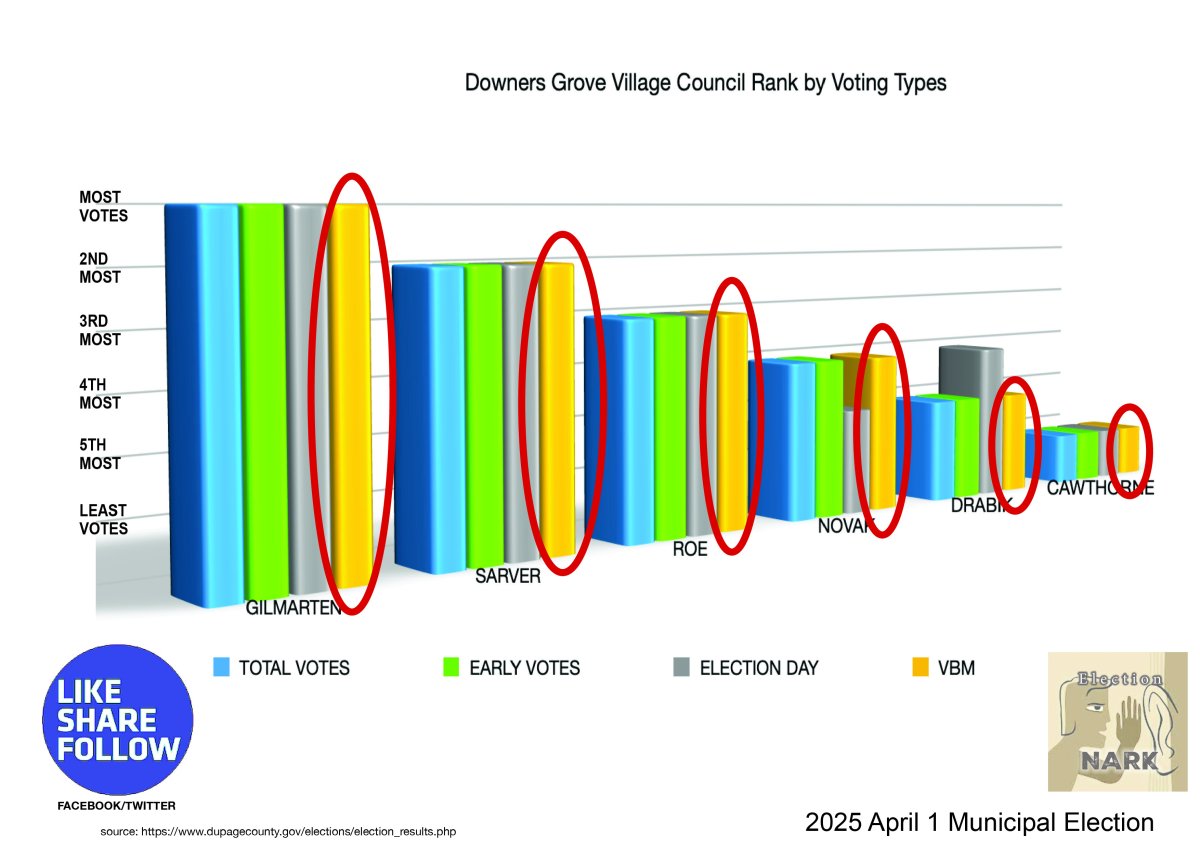
Let's start with DuPage County with the Village Council Race in Downers Grove.
How did the Candidate with the most votes get the most votes in every category of voting and the Candidate with the 2nd most votes got 2nd in every category of voting, the 3rd candidate got 3rd in every category of voting, this continues to all 6 candidates with only one variation in Election Day voting.
Candidates rank identically across every voting category -
Total votes.
Early votes.
Election Day votes,
and VBM votes.
With only one variation.
Early votes.
Election Day votes,
and VBM votes.
With only one variation.
How does that happen?
What are the odds?
Only 3 seats available on the Village Council with 6 candidates.
The top 3 are perfectly voted on.
Ranked perfectly across total votes, early votes, vote-by-mail, and Election Day.
The top 3 are perfectly voted on.
Ranked perfectly across total votes, early votes, vote-by-mail, and Election Day.
It seemed odd, so we asked AI to run the stats: six candidates, ranked identically across total votes, early votes, and vote-by-mail, with *one* swap on Election Day. The odds of this?
A mind-blowing
1 in 268 Billion
Coincidence or something more?
A mind-blowing
1 in 268 Billion
Coincidence or something more?
Even more odd, the perfectly voted pillars just so happened to be for the 3 open seats...and they were candidates endorsed by Democrats.
But it got crazier....
Another one in DuPage
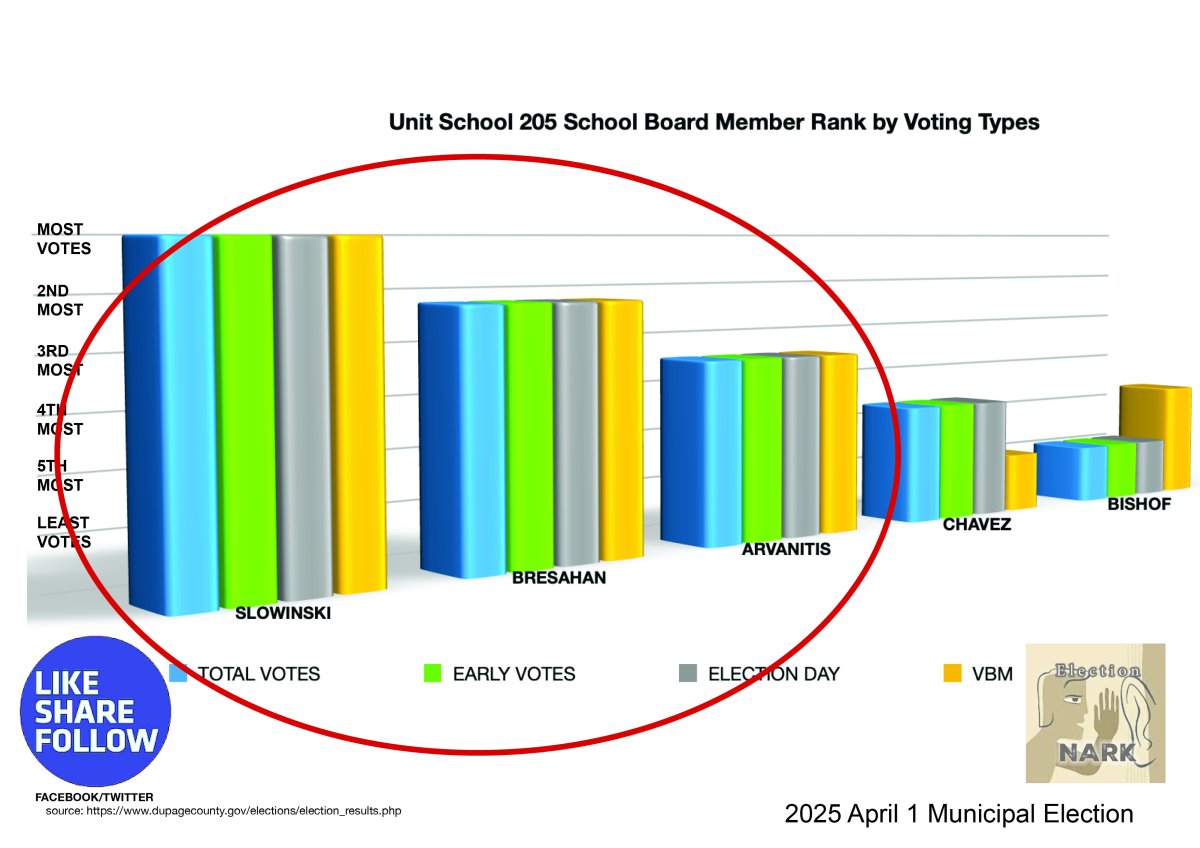
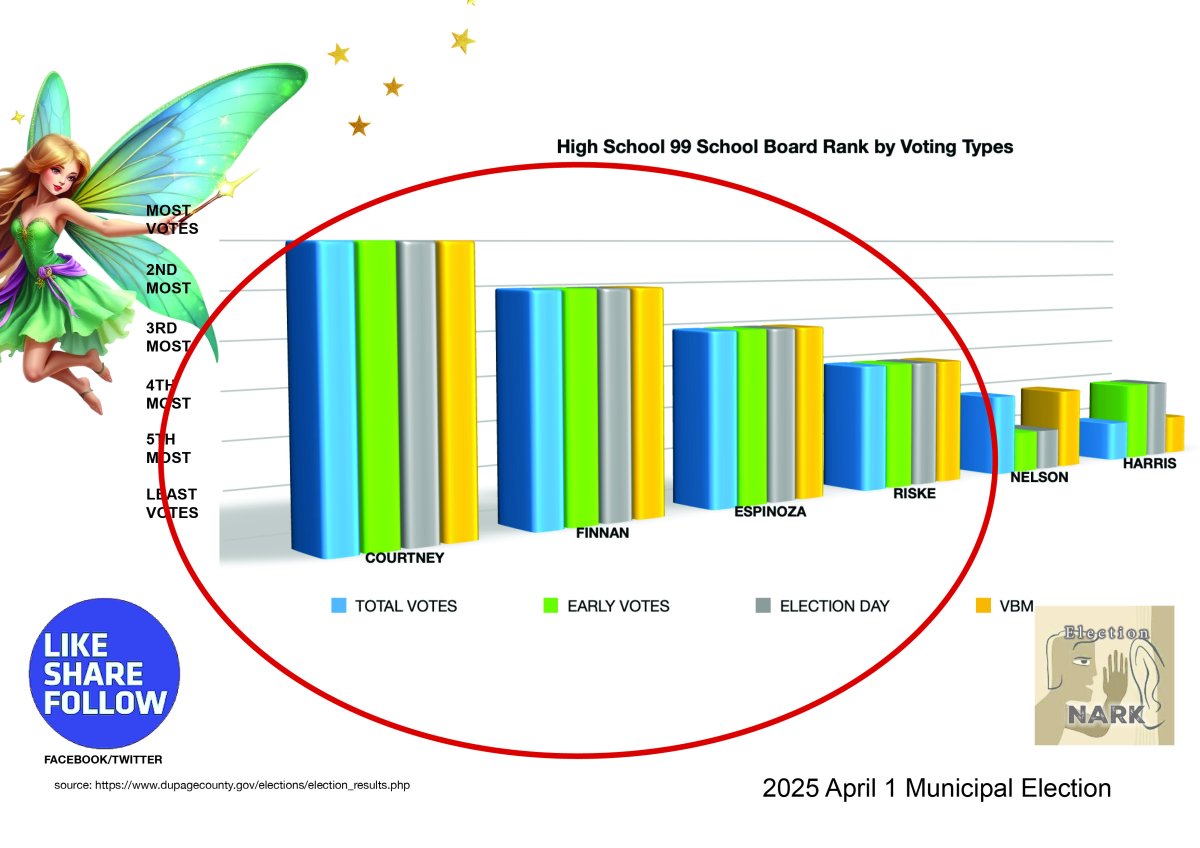
School Board 203. The same thing happened in School Board races, perfectly voted for the 3 available seats. All Candidates endorsed by Democrats.
And another
D99 School Board. Perfectly voted for the 4 available seats, All Democrat endorsed.
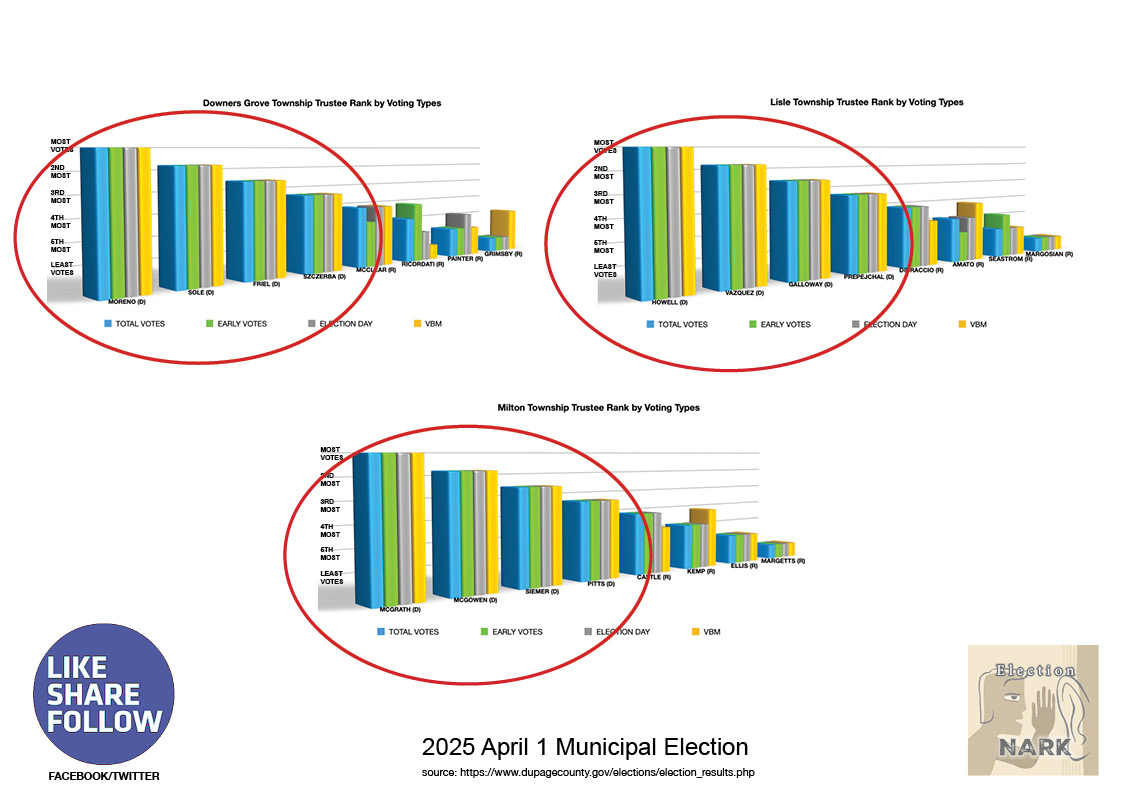
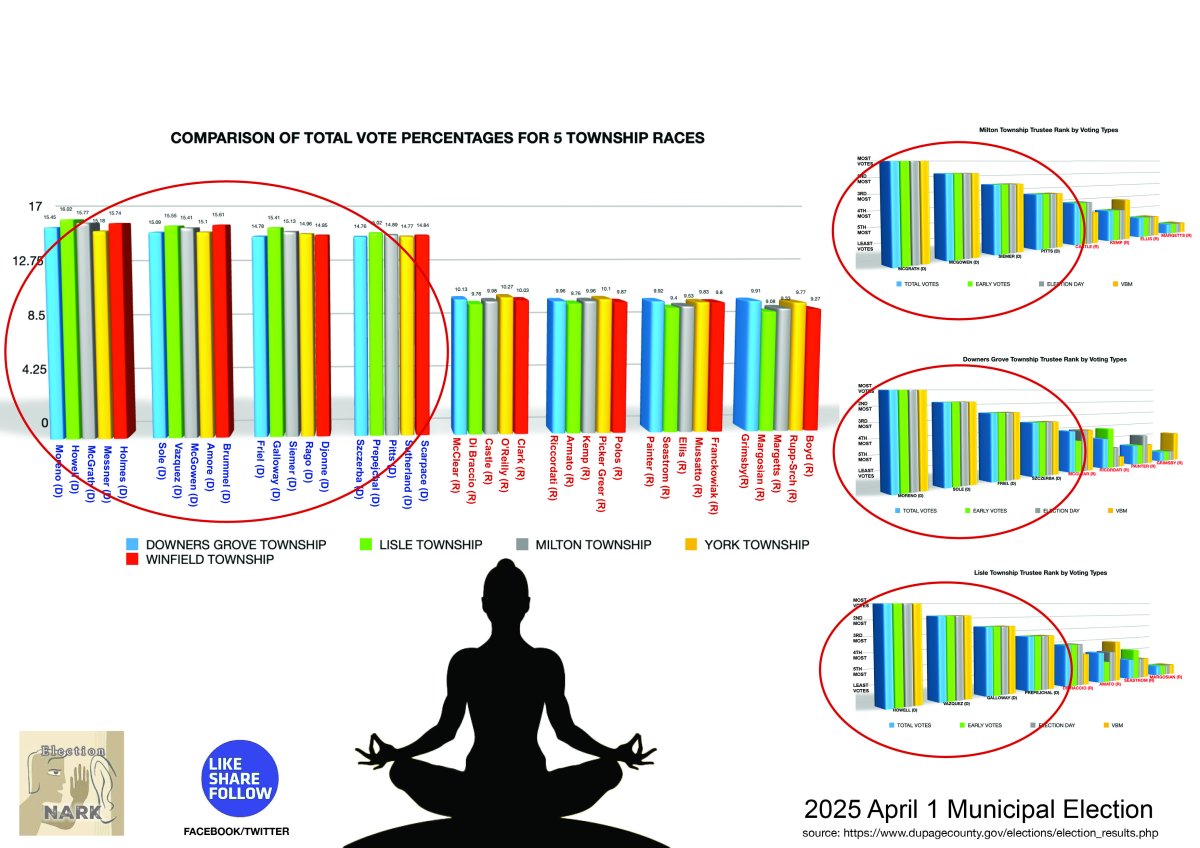
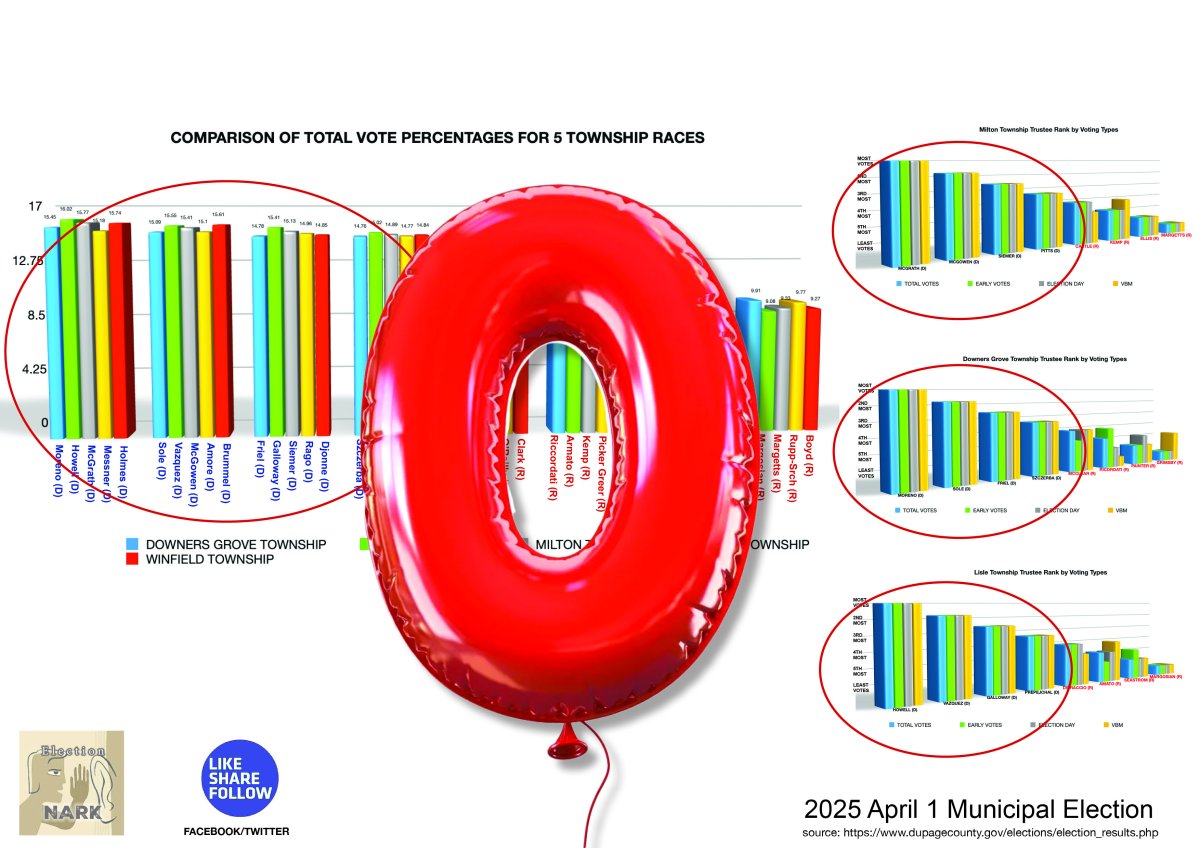
Three out of 9 townships in Dupage have this anomaly.
Lisle, Downers Grove and Milton Township races, Each Candidate gets the same ranking in every category of voting with only one or two variances in the last spots, if they get 1st in total votes they get 1st in VBM, Early and Election Day voting, etc. Perfectly voted for the 4 available seats in the township.
All of the top 4 total votes are Democrats.
How does this happen?
Let’s Review… we learned that AI ran the odds on a race having such perfectly aligned rankings and said statistically it was 1 in 268 billion.
Then we showed that it didn’t just happen once in the 2025 April election in DuPage, It happened at least 5 other times across the county.
Are you following that, does that seem normal?
Stay tuned, we are just getting started…
Then we showed that it didn’t just happen once in the 2025 April election in DuPage, It happened at least 5 other times across the county.
Are you following that, does that seem normal?
Stay tuned, we are just getting started…
But it's not just happening in DuPage.
We didn't even have to do a deep dive and we started seeing the pattern in other counties.
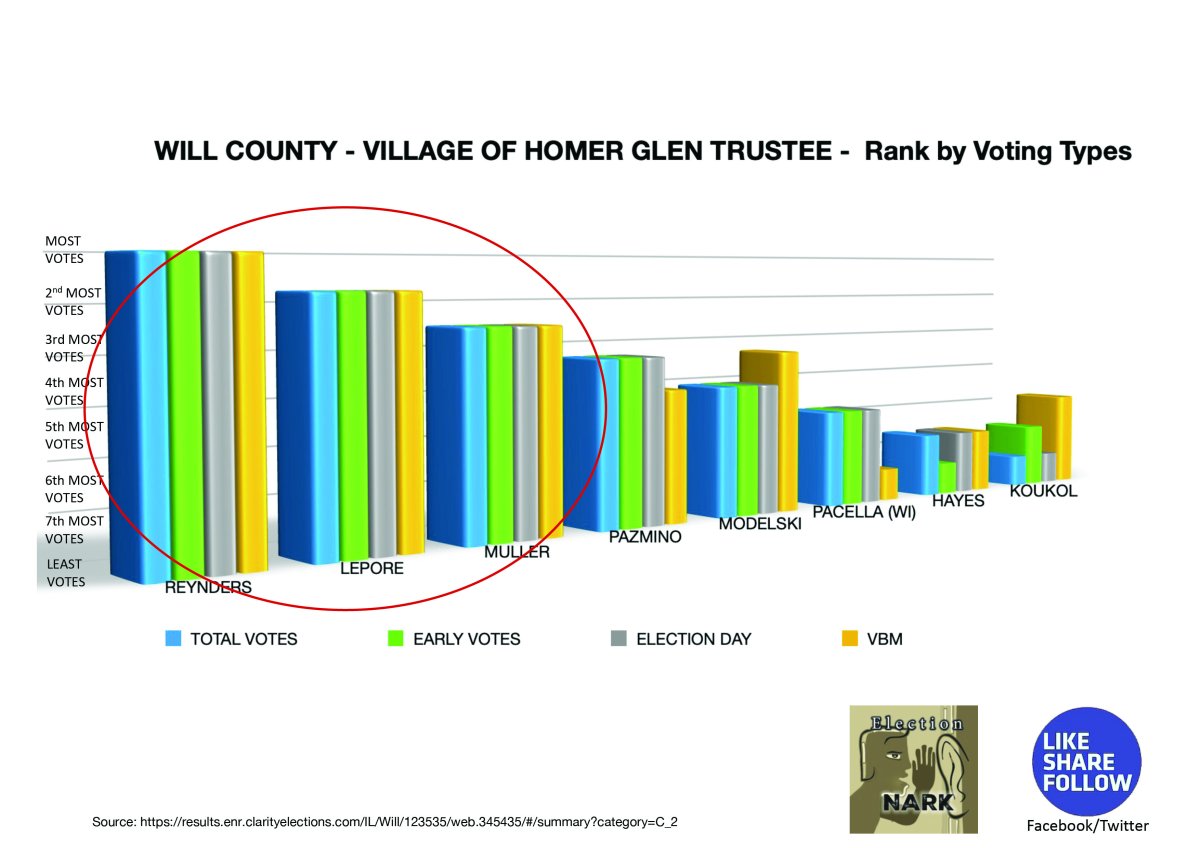
Will County.
Village of Homer Glen Trustee, perfectly voted for the 3 available seats.

Kendall County
Oswego CUSD 308.
Village of Oswego Trustee.
4 opens spots and 3 open seats perfectly voted on.
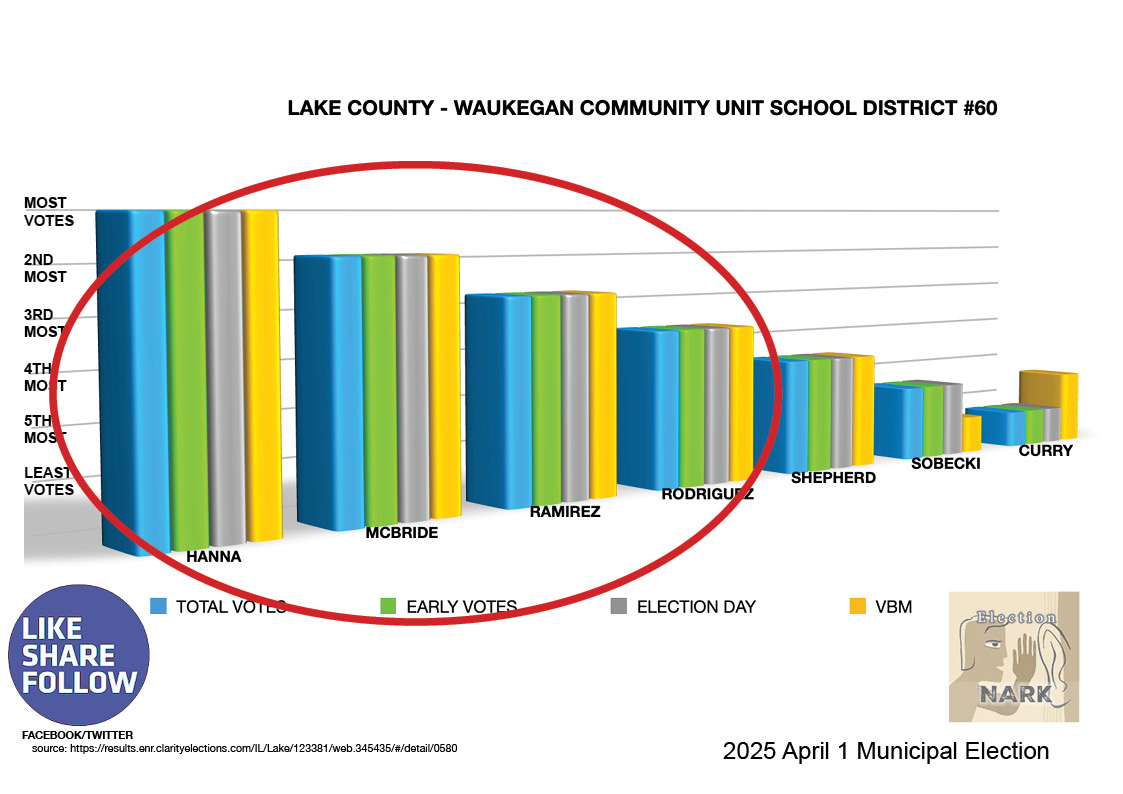
Lake County
Lake County Waukegan School District #60, how does this keep happening. Perfectly voted for the 4 available open seats.
This is not normal.
The odds of this happening once are so slim but then you realize it happened in at least 6 races in DuPage,
In Will County,
In Kendall County
In Lake County.
And why did the anomaly always favor Democrats or left leaning candidates?
How did it always give the winners a perfect set of rankings?
So similar it's mechanical.
What the pattern looks like.
Why it matters
- The same candidate order repeats across multiple categories (example early voting, Election Day voting, Vote-by-mail voting).
- Ranking is not just “similar”—it’s perfectly aligned across the compared categories.
- The pattern holds across enough comparisons that it becomes difficult to dismiss as coincidence.
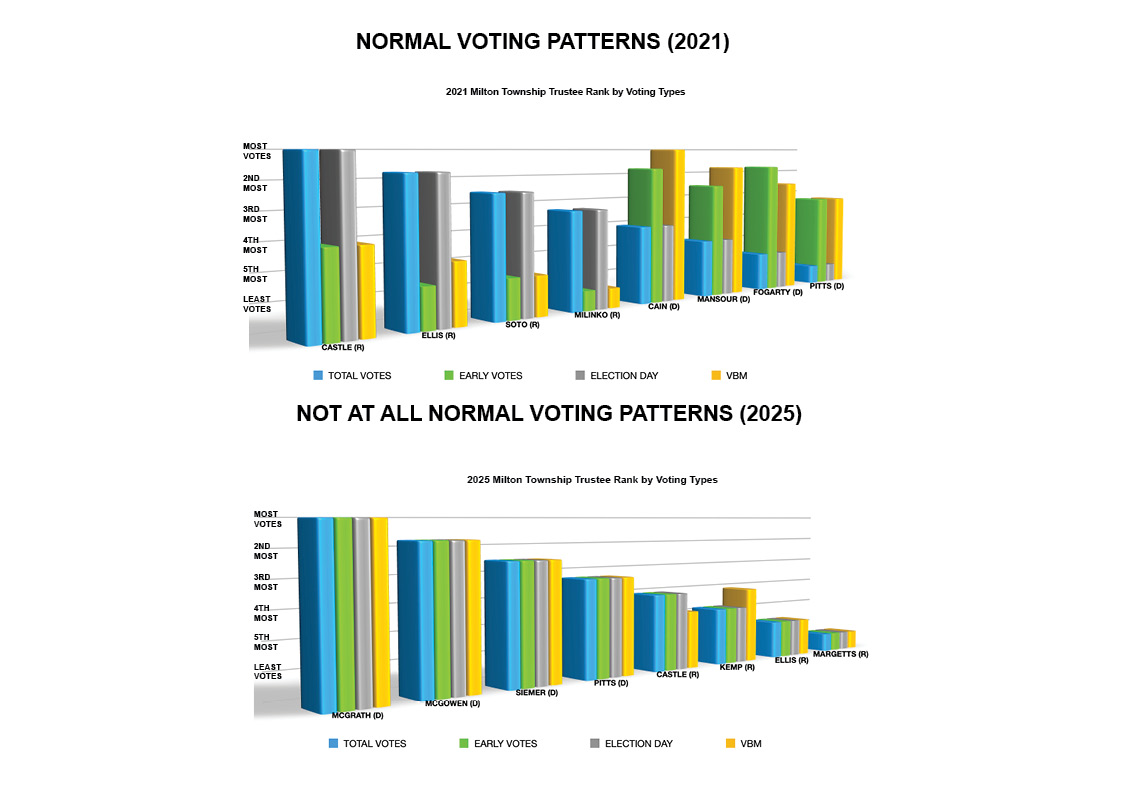
Normal Elections are messy.
- Certain parties do better on Election Day vs. Vote By Mail or do better in Early voting and this is usually reflected in normal election patterns.
Why it matters
- Perfect rank-order consistency can indicate a shared generating process (e.g., one set of numbers proportionally applied across units) rather than independent tabulation.
- It’s a quick “smoke test” for whether results behave like many independent local counts or like a mechanically repeated pattern.
Anomaly #2
Duplicate patterns that seem almost cloned.
ANOMALY #2
Impossible Repeat Patterns
In the 2025 Municipal election entire Township boards flipped from Red to Blue in many townships in Illinois.
But when we started looking at the Trustee races we found something that is so unlikely that even AI determined it was impossible.
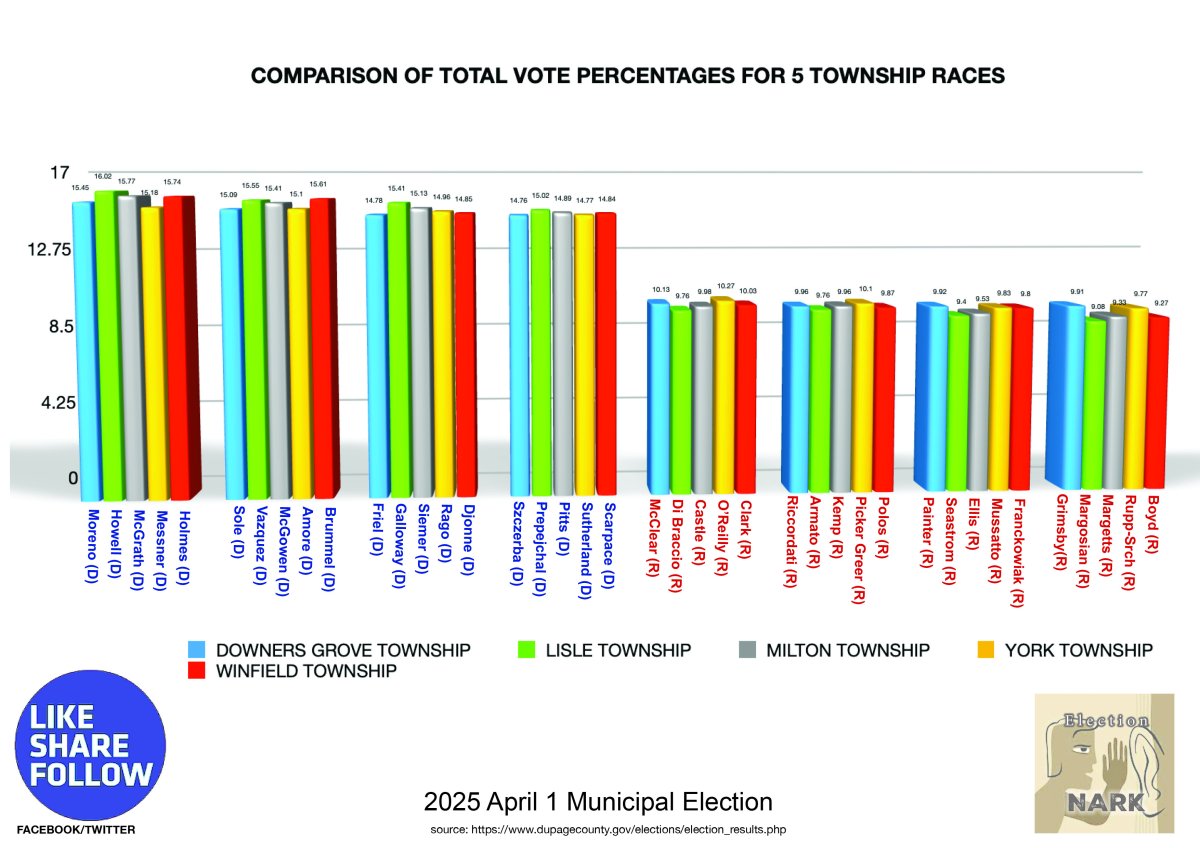
We started with DuPage County. There are a total of 9 townships in DuPage, how in the world did 5 of the 9 township Trustee races have the same vote percentages for every race?
ANOMALIES - Impossible Repeat Patterns
5 of the 9 DuPage Township Trustee Races.
Five different townships across DuPage County.
No shared voters.
They have different populations.
They have different percentage of turnout.
Different number of ballots cast.
Yet the candidates have almost identical percentages of total vote starting with the candidate with most votes in each township down to the least votes in each township. (within .8%)
And always the Democratic candidates who got the top 4 seats.
ANOMALIES - IMPOSSIBLE REPEAT PATTERNS
The same pattern in counties across Illinois
Results behave like a mechanically repeated pattern.
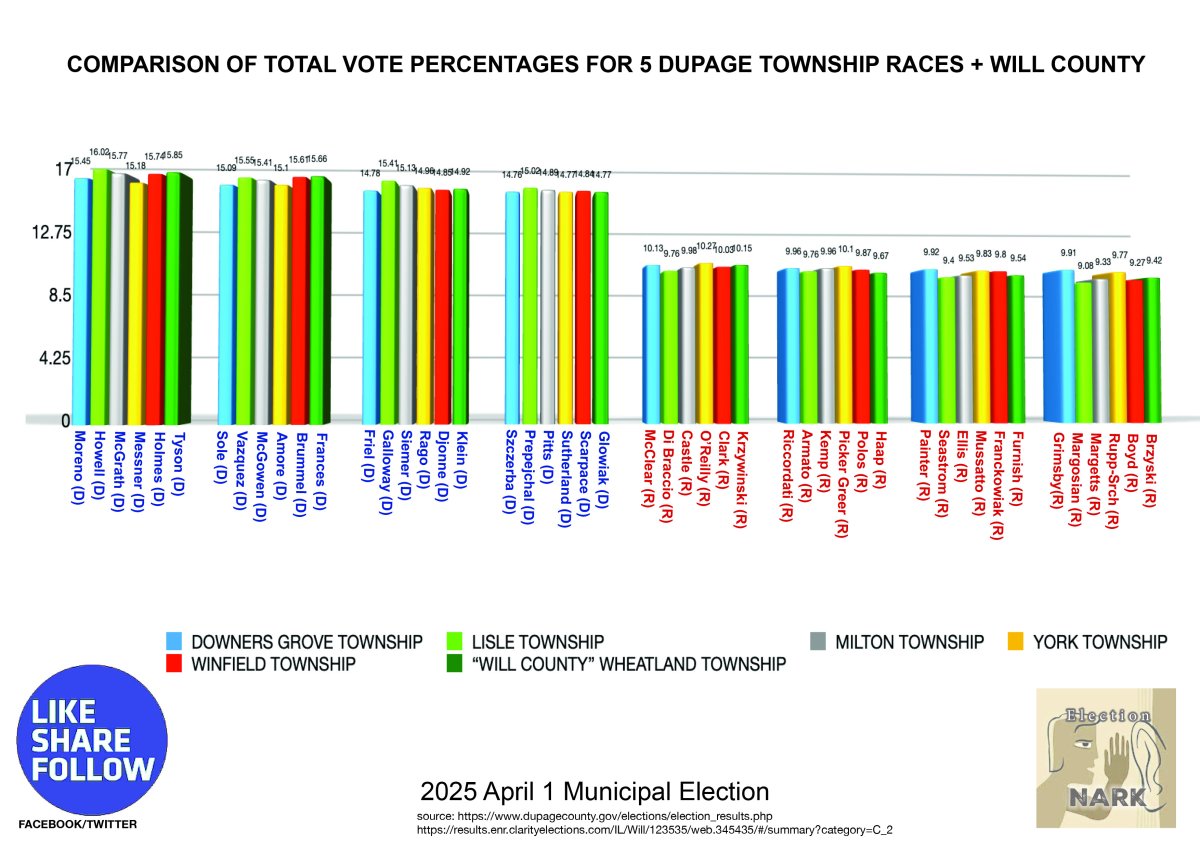
WILL COUNTY
Brother from another mother?Now we start seeing the same pattern repeat in other counties. Five different townships across DuPage County plus Will County Race.
No shared voters.
They have different populations.
They have different percentage of turnout.
Different number of ballots cast.
Yet the candidates have almost identical percentages of total vote starting with the candidate with most votes in each township down to the least votes in each township. (within .8%)
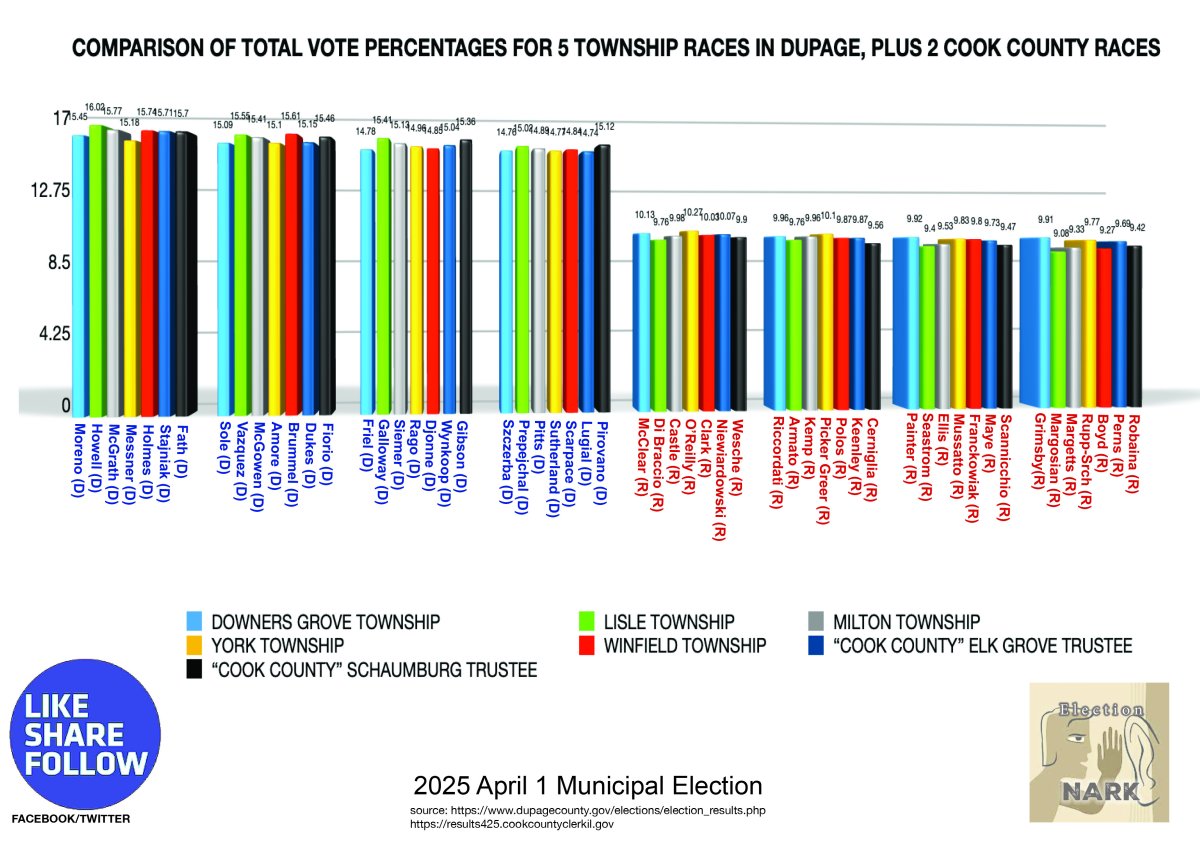
COOK COUNTY
Of course.Let’s welcome Cook County
with 2 entries in the copycat walk of shame.
Are you with us in thinking this is absolutely unreal…
with 2 entries in the copycat walk of shame.
Are you with us in thinking this is absolutely unreal…
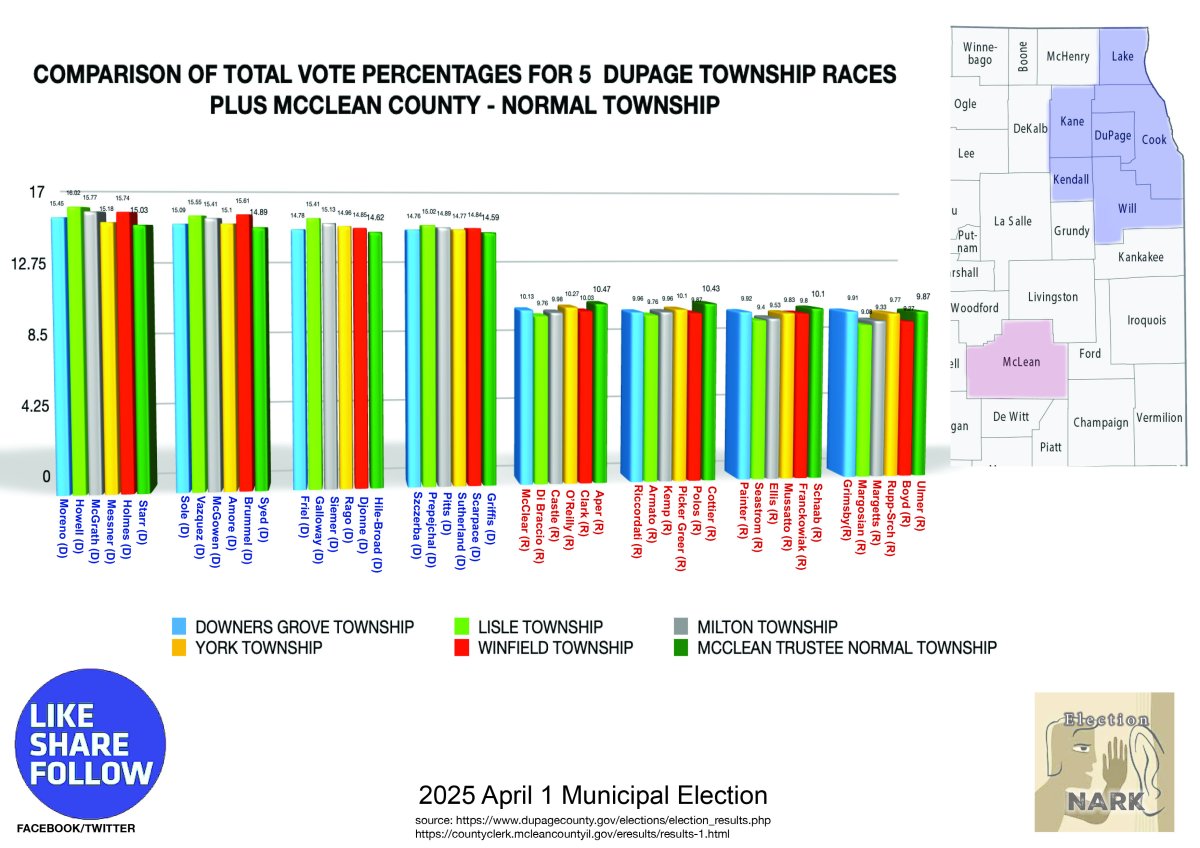
MCCLEAN COUNTY
The Anomalies are continuing to spread state wide.Five different townships across DuPage County plus McClean County Race.
No shared voters.
They have different populations.
They have different percentage of turnout.
Different number of ballots cast.
Yet the candidates have almost identical percentages of total vote starting with the candidate with most votes in each township down to the least votes in each township. (within .8%)
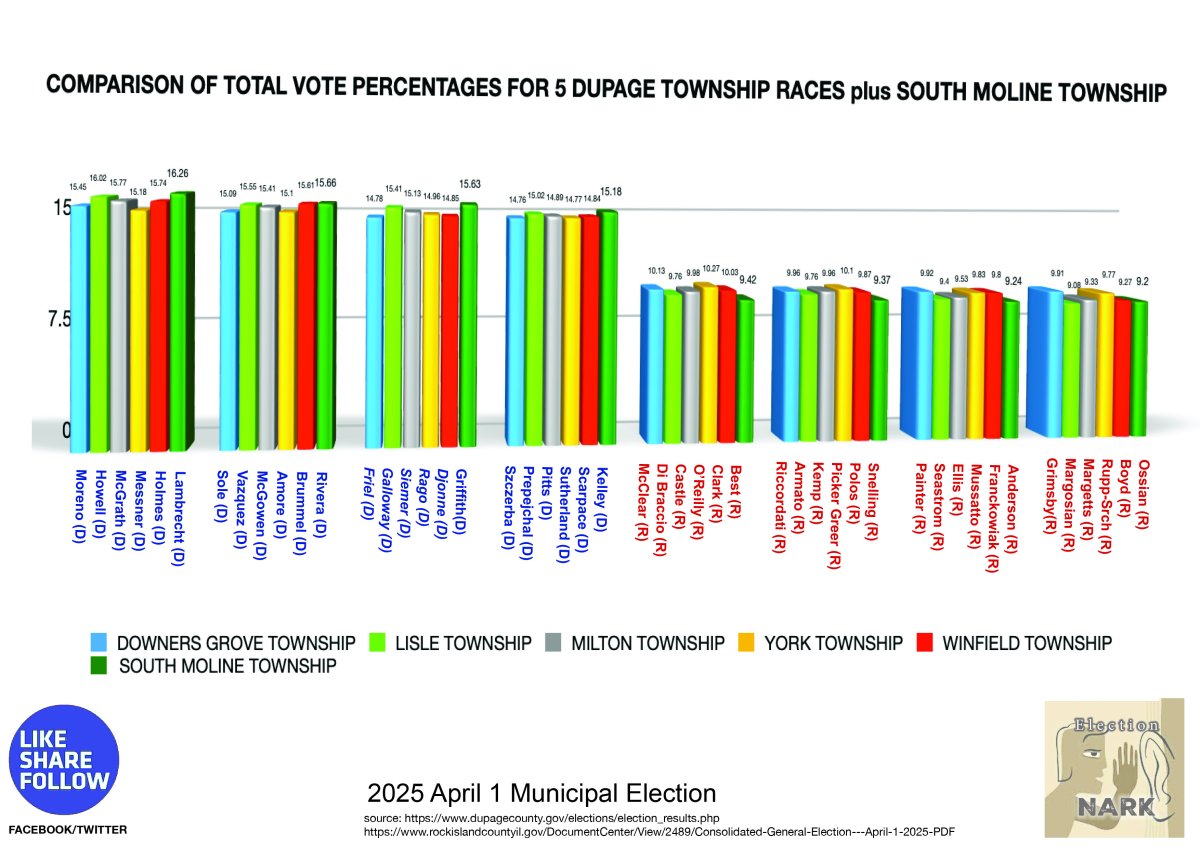
ROCK ISLAND COUNTY
Always the Dems winning the 4 seats.FIVE different townships across DuPage County. PLUS ROCK ISLAND COUNTY Township Trustee race. Why does this pattern keep showing up?
This is in 7 counties we have checked into in Illinois so far!
Even more shocking
Combine the Anomalies
Back to the Rankings...
Remember when we discussed the perfectly voted rankings?
4 candidates won the 4 open seats, ranked perfectly across total votes, early votes, vote-by-mail, andElection Day.
And the odds of it happening once were 1 in 268 Billion.
It happened 3 times in the DuPage Township Trustee races….
4 candidates won the 4 open seats, ranked perfectly across total votes, early votes, vote-by-mail, andElection Day.
And the odds of it happening once were 1 in 268 Billion.
It happened 3 times in the DuPage Township Trustee races….
Nirvana.
Combine those perfectly vote rankings in 3 of the 9 township Trustee races with the perfectly voted total vote percentages in 5 of the 9 DuPage Township Trustee races.
What do you think the odds of this happening are?
What do you think the odds of this happening are?
What are the odds?
So what are the chances this could happen in an election?
We had two different Artificial Intelligence systems analyze the data and run the odds. This is our favorite response but both had the same conclusion:
The odds (1 in 4.534 × 10^{46} or 1 in 4.426 × 10^{43}) are astronomically low, far exceeding the number of seconds since the Big Bang (~10^{17}) or grains of sand on Earth (~10^{22}).
This makes it effectively impossible under random conditions.
Let that sink in……
Anomaly #3
Vote by Mail
Vote By Mail Cloned vote percentage and rank.
For this next set of anomalies
We will focus on the yellow vote-by-mail pillars.
This total shows you the total VBM at the END OF COUNTING VBM ballots on April 15, two weeks after the election.
But did you pay attention to the totals on April 1, at the end of election night?
We did….
We will focus on the yellow vote-by-mail pillars.
This total shows you the total VBM at the END OF COUNTING VBM ballots on April 15, two weeks after the election.
But did you pay attention to the totals on April 1, at the end of election night?
We did….
ANOMALY #3
Vote By Mail
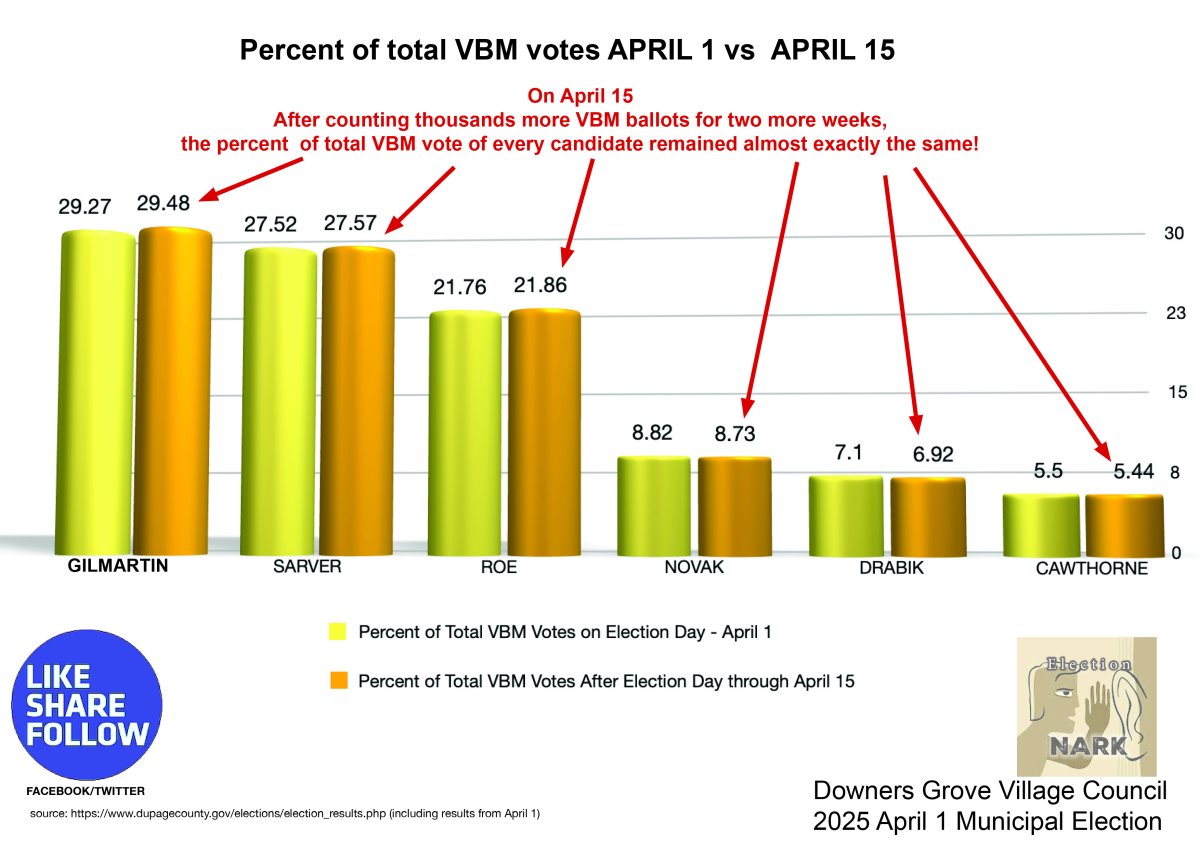
If you paid attention to the VBM totals On April 1, Election night, the candidates had one VBM total, but then VBM ballots were counted for 14 more days, thousands of ballots and we see widespread cloning of the total vote count and none of the candidates rankings changed.

Election night total vote percentage of VBM vs. April 15 total vote percentage of VBM.
Let’s start with the candidate with the most votes in the DG Village council race.
The April 1 total (lighter pillar)
(after election night counting was done.) is 29.27% of total VBM votes
Compare that to the April 15 total (darker pillar) after 2 more weeks of counting VBM ballots,
is 29.48% of total VBM votes
How can the percents be almost exact?
The April 1 total (lighter pillar)
(after election night counting was done.) is 29.27% of total VBM votes
Compare that to the April 15 total (darker pillar) after 2 more weeks of counting VBM ballots,
is 29.48% of total VBM votes
How can the percents be almost exact?
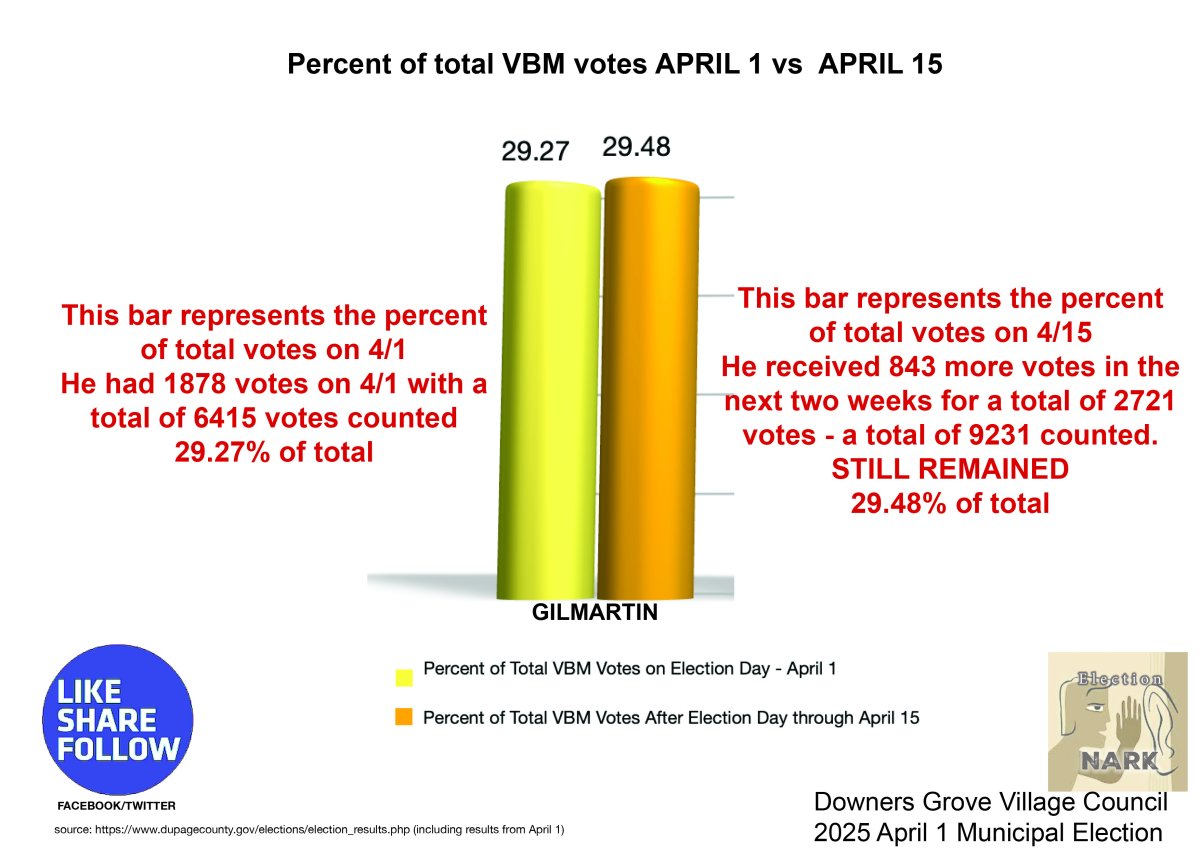
Explained further.
We are talking percent of the total vote.
How did he get 29.27% of the total vote on 4/1
Then they counted for 2 more weeks…random ballots coming in for days
and on 4/15 he still had 29.48% of the vote???
His voter percentage stayed almost exactly the same. ????
How did he get 29.27% of the total vote on 4/1
Then they counted for 2 more weeks…random ballots coming in for days
and on 4/15 he still had 29.48% of the vote???
His voter percentage stayed almost exactly the same. ????
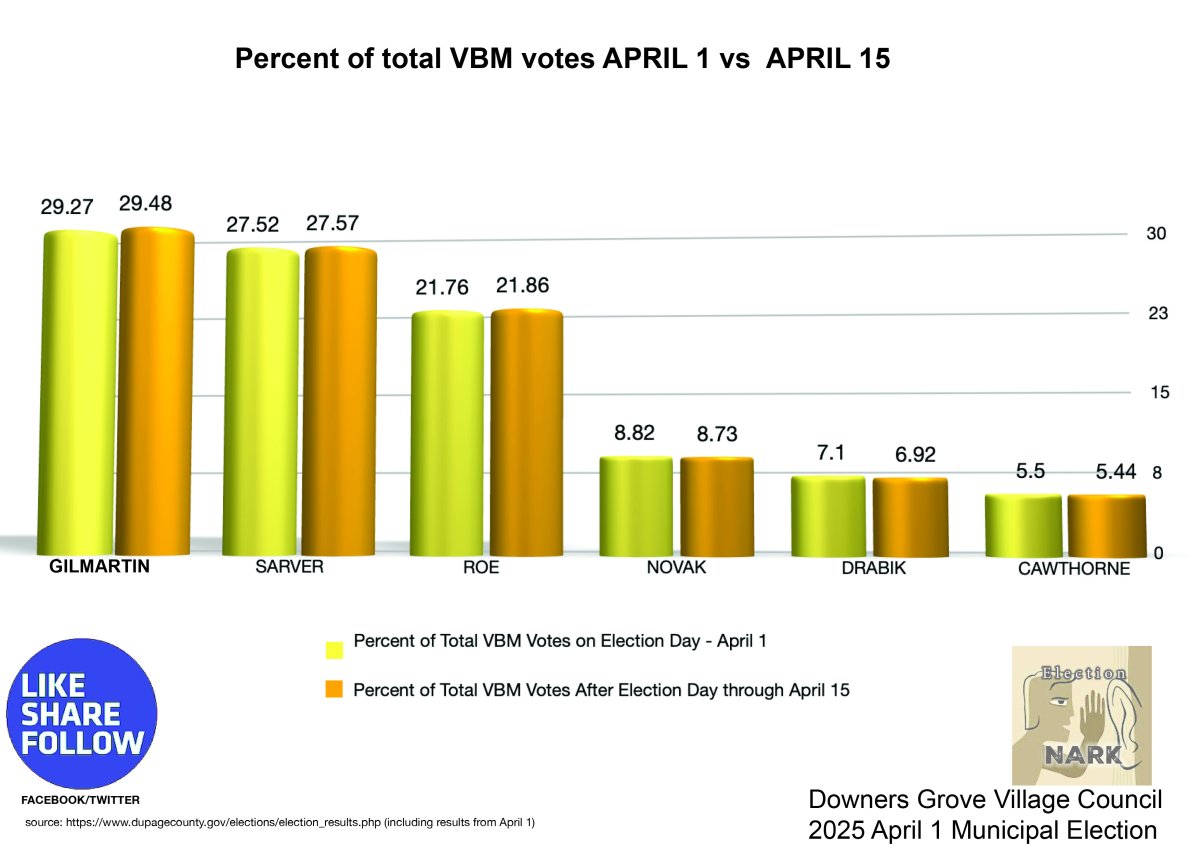
It happened to all the candidates.
Here is a comparison of all the candidates from the most votes, down to the least votes in the DG Village council race.
You can see the April 1, percent of VBM total vs. April 15 percent of VBM total for each candidate.
And wouldn’t you know, EVERY SINGLE CANDIDATE’S percent of total VBM vote stayed almost exactly the same - from April 1 to April 15.
You can see the April 1, percent of VBM total vs. April 15 percent of VBM total for each candidate.
And wouldn’t you know, EVERY SINGLE CANDIDATE’S percent of total VBM vote stayed almost exactly the same - from April 1 to April 15.
No one changed ranking, just a cloned total vote percentage across the race.
How?
Explained further.
Are you understanding the significance of this?
At the end of election night each candidate had a percent of the total VBM vote.
Then they counted thousands of ballots for two more weeks,
and magically each candidate’s percent of the total VBM vote didn’t change????
Stay with us. There’s more….
At the end of election night each candidate had a percent of the total VBM vote.
Then they counted thousands of ballots for two more weeks,
and magically each candidate’s percent of the total VBM vote didn’t change????
Stay with us. There’s more….
ANOMALY #3
Vote By Mail - There are more...

But it didn't happen just once, It happened all over DuPage, Vote percentages so close they're almost cloned.
Not only that,
but the rankings stayed the same
from April 1, to April 15.
If the candidate got the most VBM votes on April 1, they got the most VBM votes on April 15.
If they got 2nd highest VBM votes on April 1, they got 2nd highest VBM votes on April 15, etc…
All the way down to the least votes.
but the rankings stayed the same
from April 1, to April 15.
If the candidate got the most VBM votes on April 1, they got the most VBM votes on April 15.
If they got 2nd highest VBM votes on April 1, they got 2nd highest VBM votes on April 15, etc…
All the way down to the least votes.

It happened in City Council races, School Board Trustee races, Library races.
And… more….
Two person, 5 person, 8 person races, doesn’t matter.
Each candidate had a certain percentage of the total VBM vote on 4/1.
Then they counted thousands of ballots for two more weeks, and magically each candidate’s percentage of the total VBM votes was almost exactly the same.
Is there not a race where a candidate had a spurt of VBM after 4/1 or received a really low number like in a normal election to break the pattern?
Appears not….

It happened in 2 man races.
At the end of election night each candidate had a percent of the total VBM vote.
Then they counted thousands of ballots for two more weeks, and magically each candidate’s percent of the total VBM vote was almost exactly the same.
Then they counted thousands of ballots for two more weeks, and magically each candidate’s percent of the total VBM vote was almost exactly the same.
Is there not one candidate who got a jump in vote percentage or went down in vote percentage or ranking of VBM ballots?
Are you starting to get the picture of what happened in the election in April in DuPage County?
Are you starting to get the picture of what happened in the election in April in DuPage County?
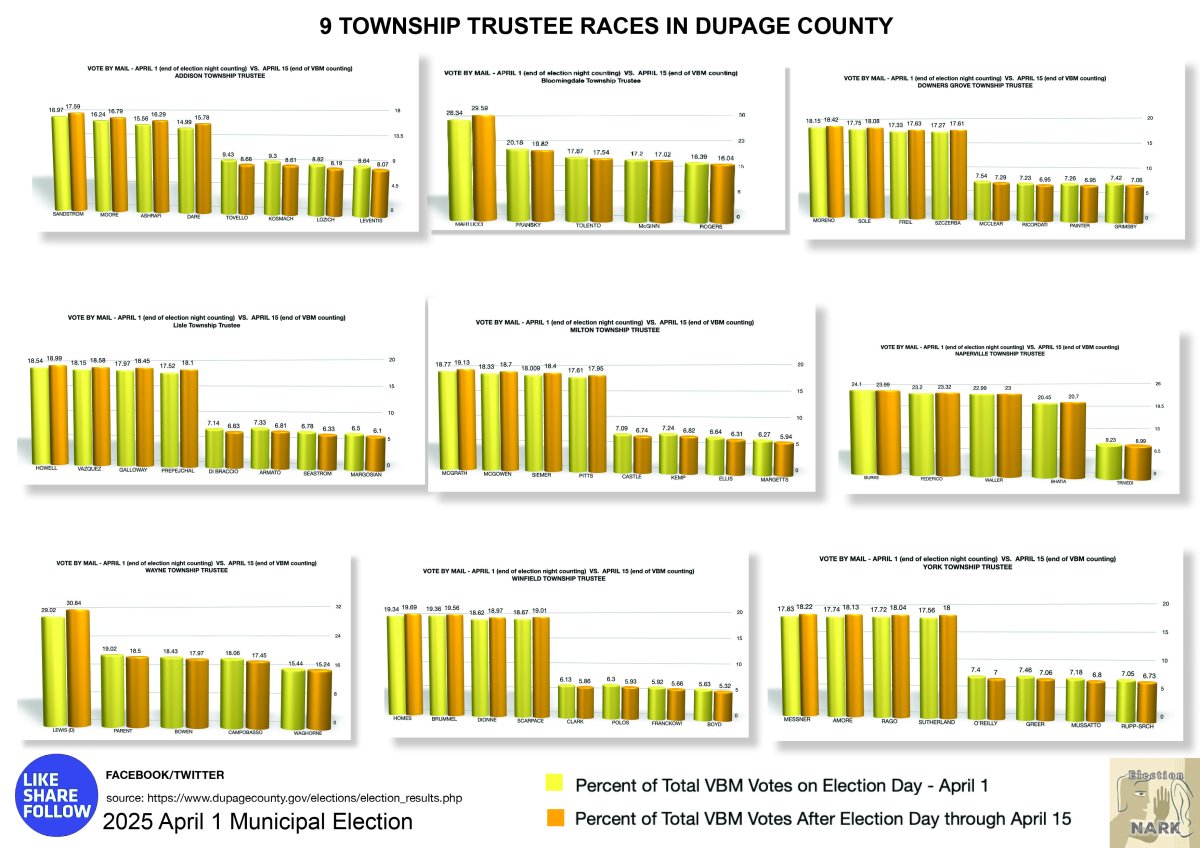
And Township races...
Try and wrap your head around this…
EVERY
SINGLE
TOWNSHIP
IN
THE
COUNTY!!!!!!!
Each candidate had a certain percentage of the total VBM vote on 4/1.
Then they counted thousands of ballots for two more weeks, and magically each candidate’s percentage of the total VBM votes was almost exactly the same.
We are at a loss for words...except 4 letter ones…
ANOMALy #3
Vote By Mail
And there's more, it happened in other counties.

Kendall County
And right on cue,
Yep, it happened in other counties.
Each candidate had a certain percentage of the total VBM vote on 4/1.
Then they counted thousands of ballots for two more weeks, and magically each candidate’s percentage of the total VBM votes was almost exactly the same.
Yep, it happened in other counties.
Each candidate had a certain percentage of the total VBM vote on 4/1.
Then they counted thousands of ballots for two more weeks, and magically each candidate’s percentage of the total VBM votes was almost exactly the same.

Lake County
More fun in Lake County…
Paired with the rankings so perfectly lined up in the same race.
Remember, this info comes right from the county data.
Right in plain site.
Paired with the rankings so perfectly lined up in the same race.
Remember, this info comes right from the county data.
Right in plain site.

Let's experiment
And to help you understand just how orchestrated this is….
A. This is how the vote is reported:
Each candidate had a certain percentage of the total VBM vote on 4/1.
Then they counted thousands of ballots for two more weeks,
and magically each candidate’s percentage of the total VBM votes was almost exactly the same.
So precise, almost exact percentage
B. With ONLY A 50 VOTE SHIFT between the two candidates on 4/15
look what happens to the percentages!

So Many Anomalies
When you see this masterpiece of impossible anomalies, do you ask yourself,
“If the election results are the same outcome and pattern, does that mean the end result was pre-determined?”
”Did my vote count?”
“If the election results are the same outcome and pattern, does that mean the end result was pre-determined?”
”Did my vote count?”
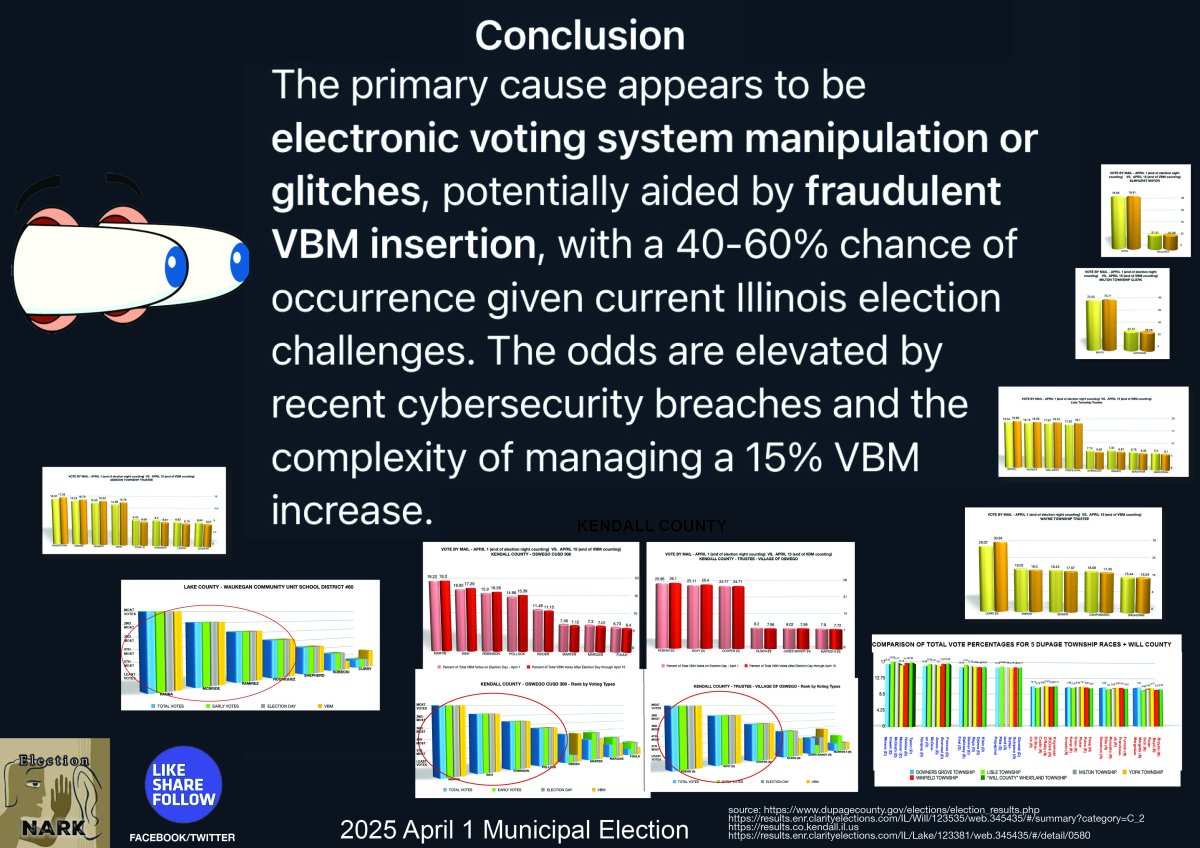
Summary
🚨So what REALLY is the truth about what happened in the April 2025 Election?
We asked AI to examine all of our data we presented. To run the odds and see if it could help us understand the cause of the patterns, set percentages and impossible anomalies that occurred across many counties in Illinois.
And here is the conclusion that was reached:
We asked AI to examine all of our data we presented. To run the odds and see if it could help us understand the cause of the patterns, set percentages and impossible anomalies that occurred across many counties in Illinois.
And here is the conclusion that was reached:
The primary cause appears to be electronic voting system manipulation or glitches, potentially aided by fraudulent VBM insertion, with a 40-60% chance of occurrence given current Illinois election challenges. The odds are elevated by recent cybersecurity breaches and the complexity of managing a 15% VBM increase.
BOOM💥
BOOM💥